Atlanta — Nov 06, 2026
After a decade or more of steady demand for electricity, increased popularity of EVs and the rise of AI data centers have led to increased electrical consumption in the 2020s.[1] As a result, people might look to adding solar panels to their homes as a hedge against rising costs or out of concern for the environment. What are the trends in residential solar adoption?
To answer this question, we use data from the 2025 American Community Survey 1-year release,[2] which included a new question on residential solar.[3]
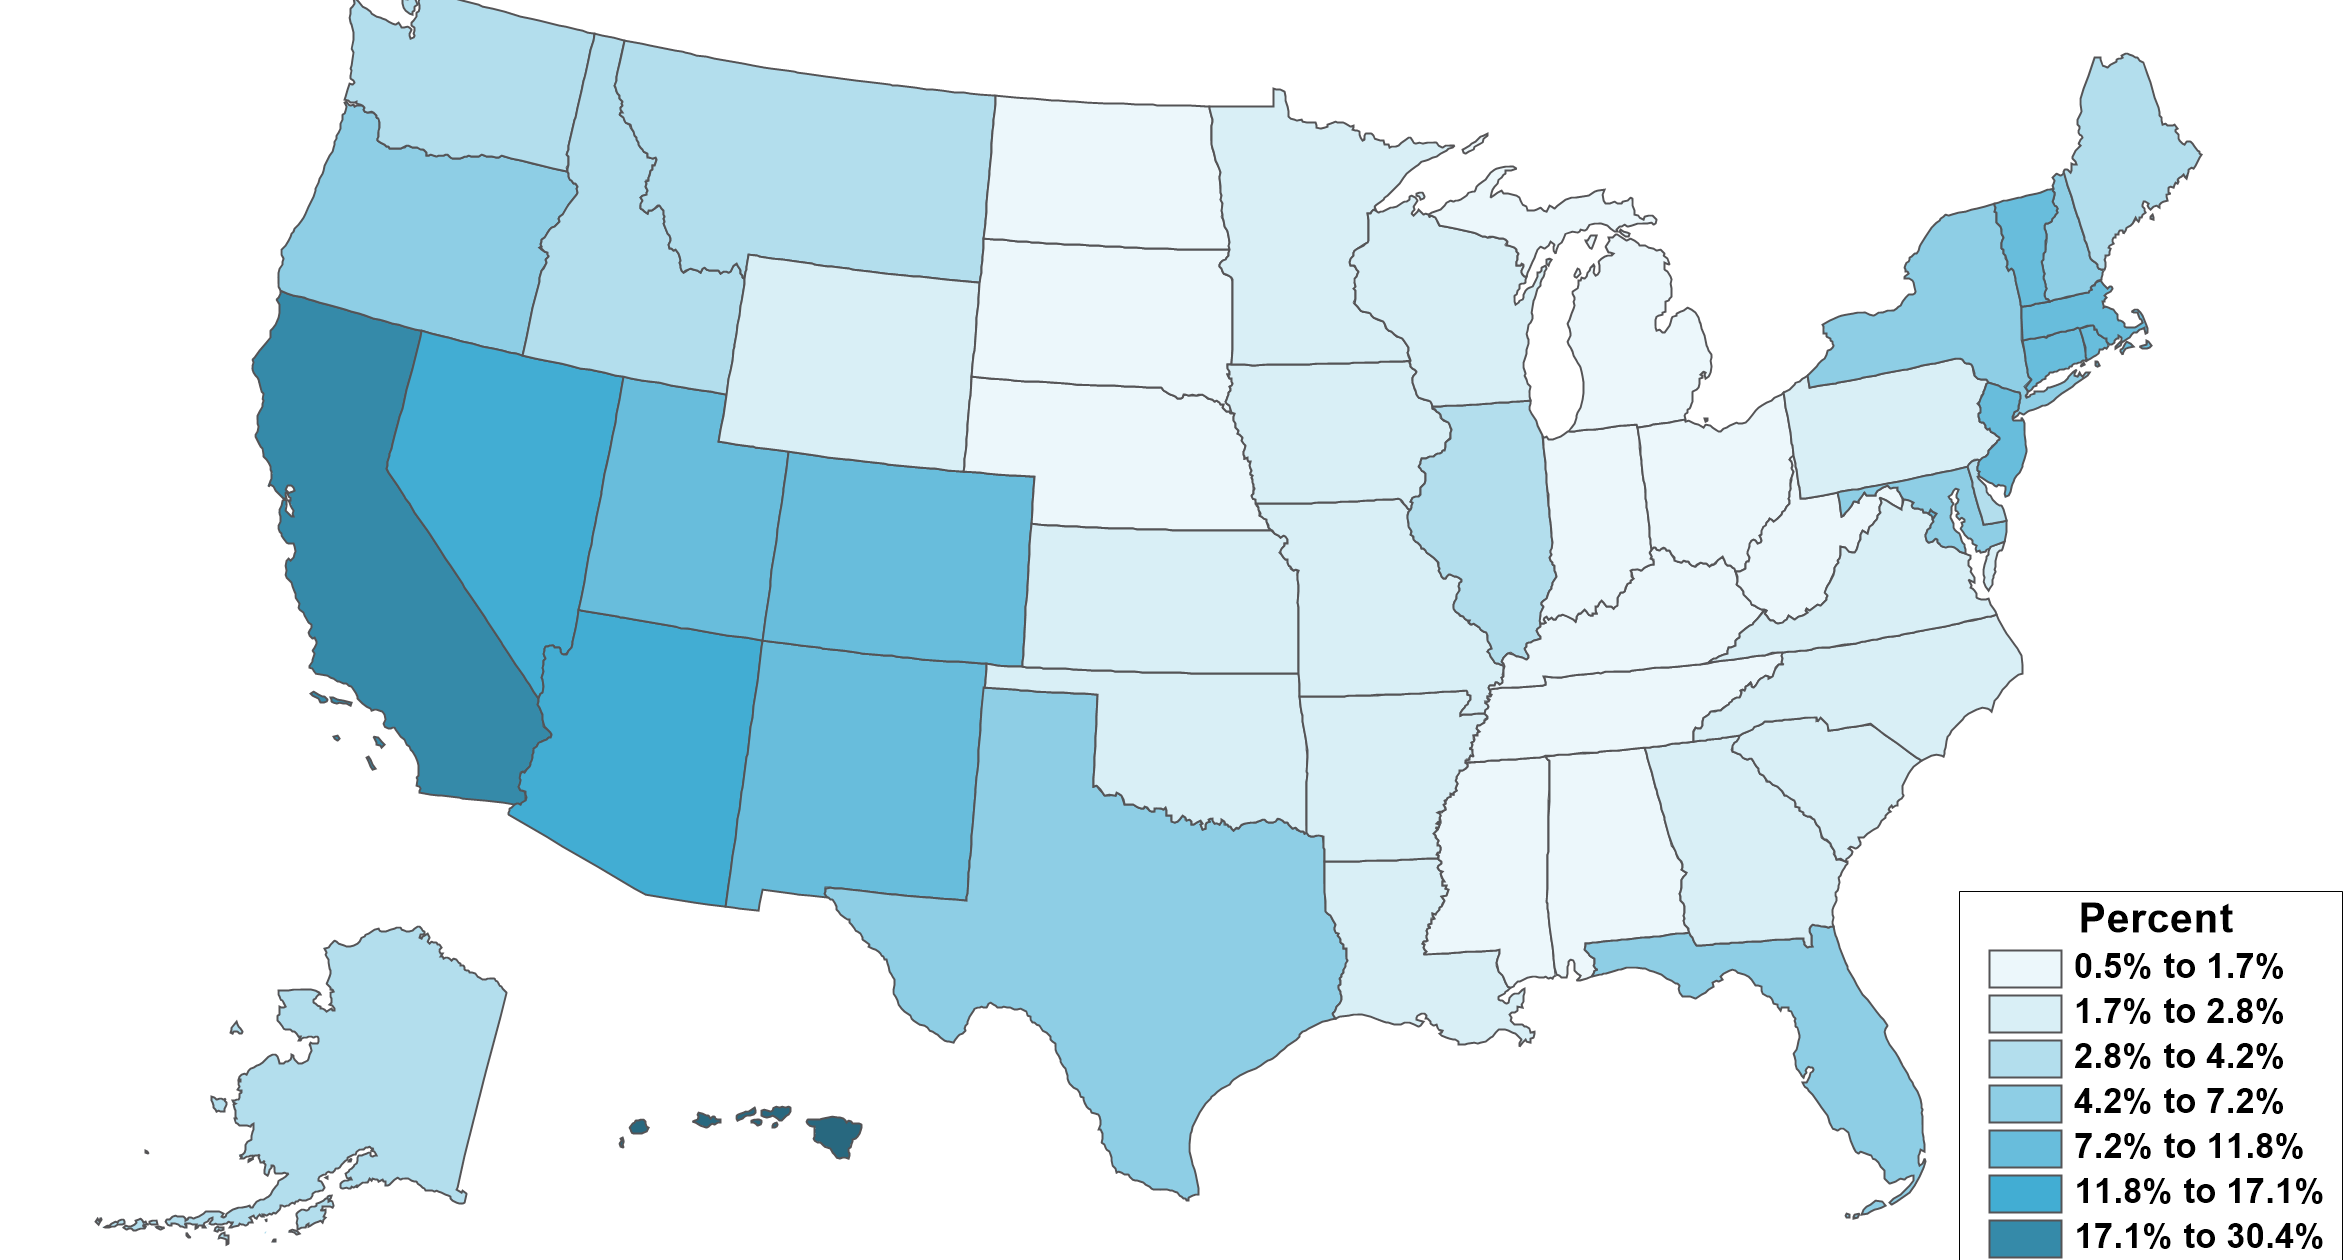
Figure 1 presents a map showing the percentage of housing units with residential solar by state. Categories are based on the Jenks “natural breaks” method, which helps highlight meaningful differences and identify outliers.
Figure 1: Percentage of Housing Units with Residential Solar by State
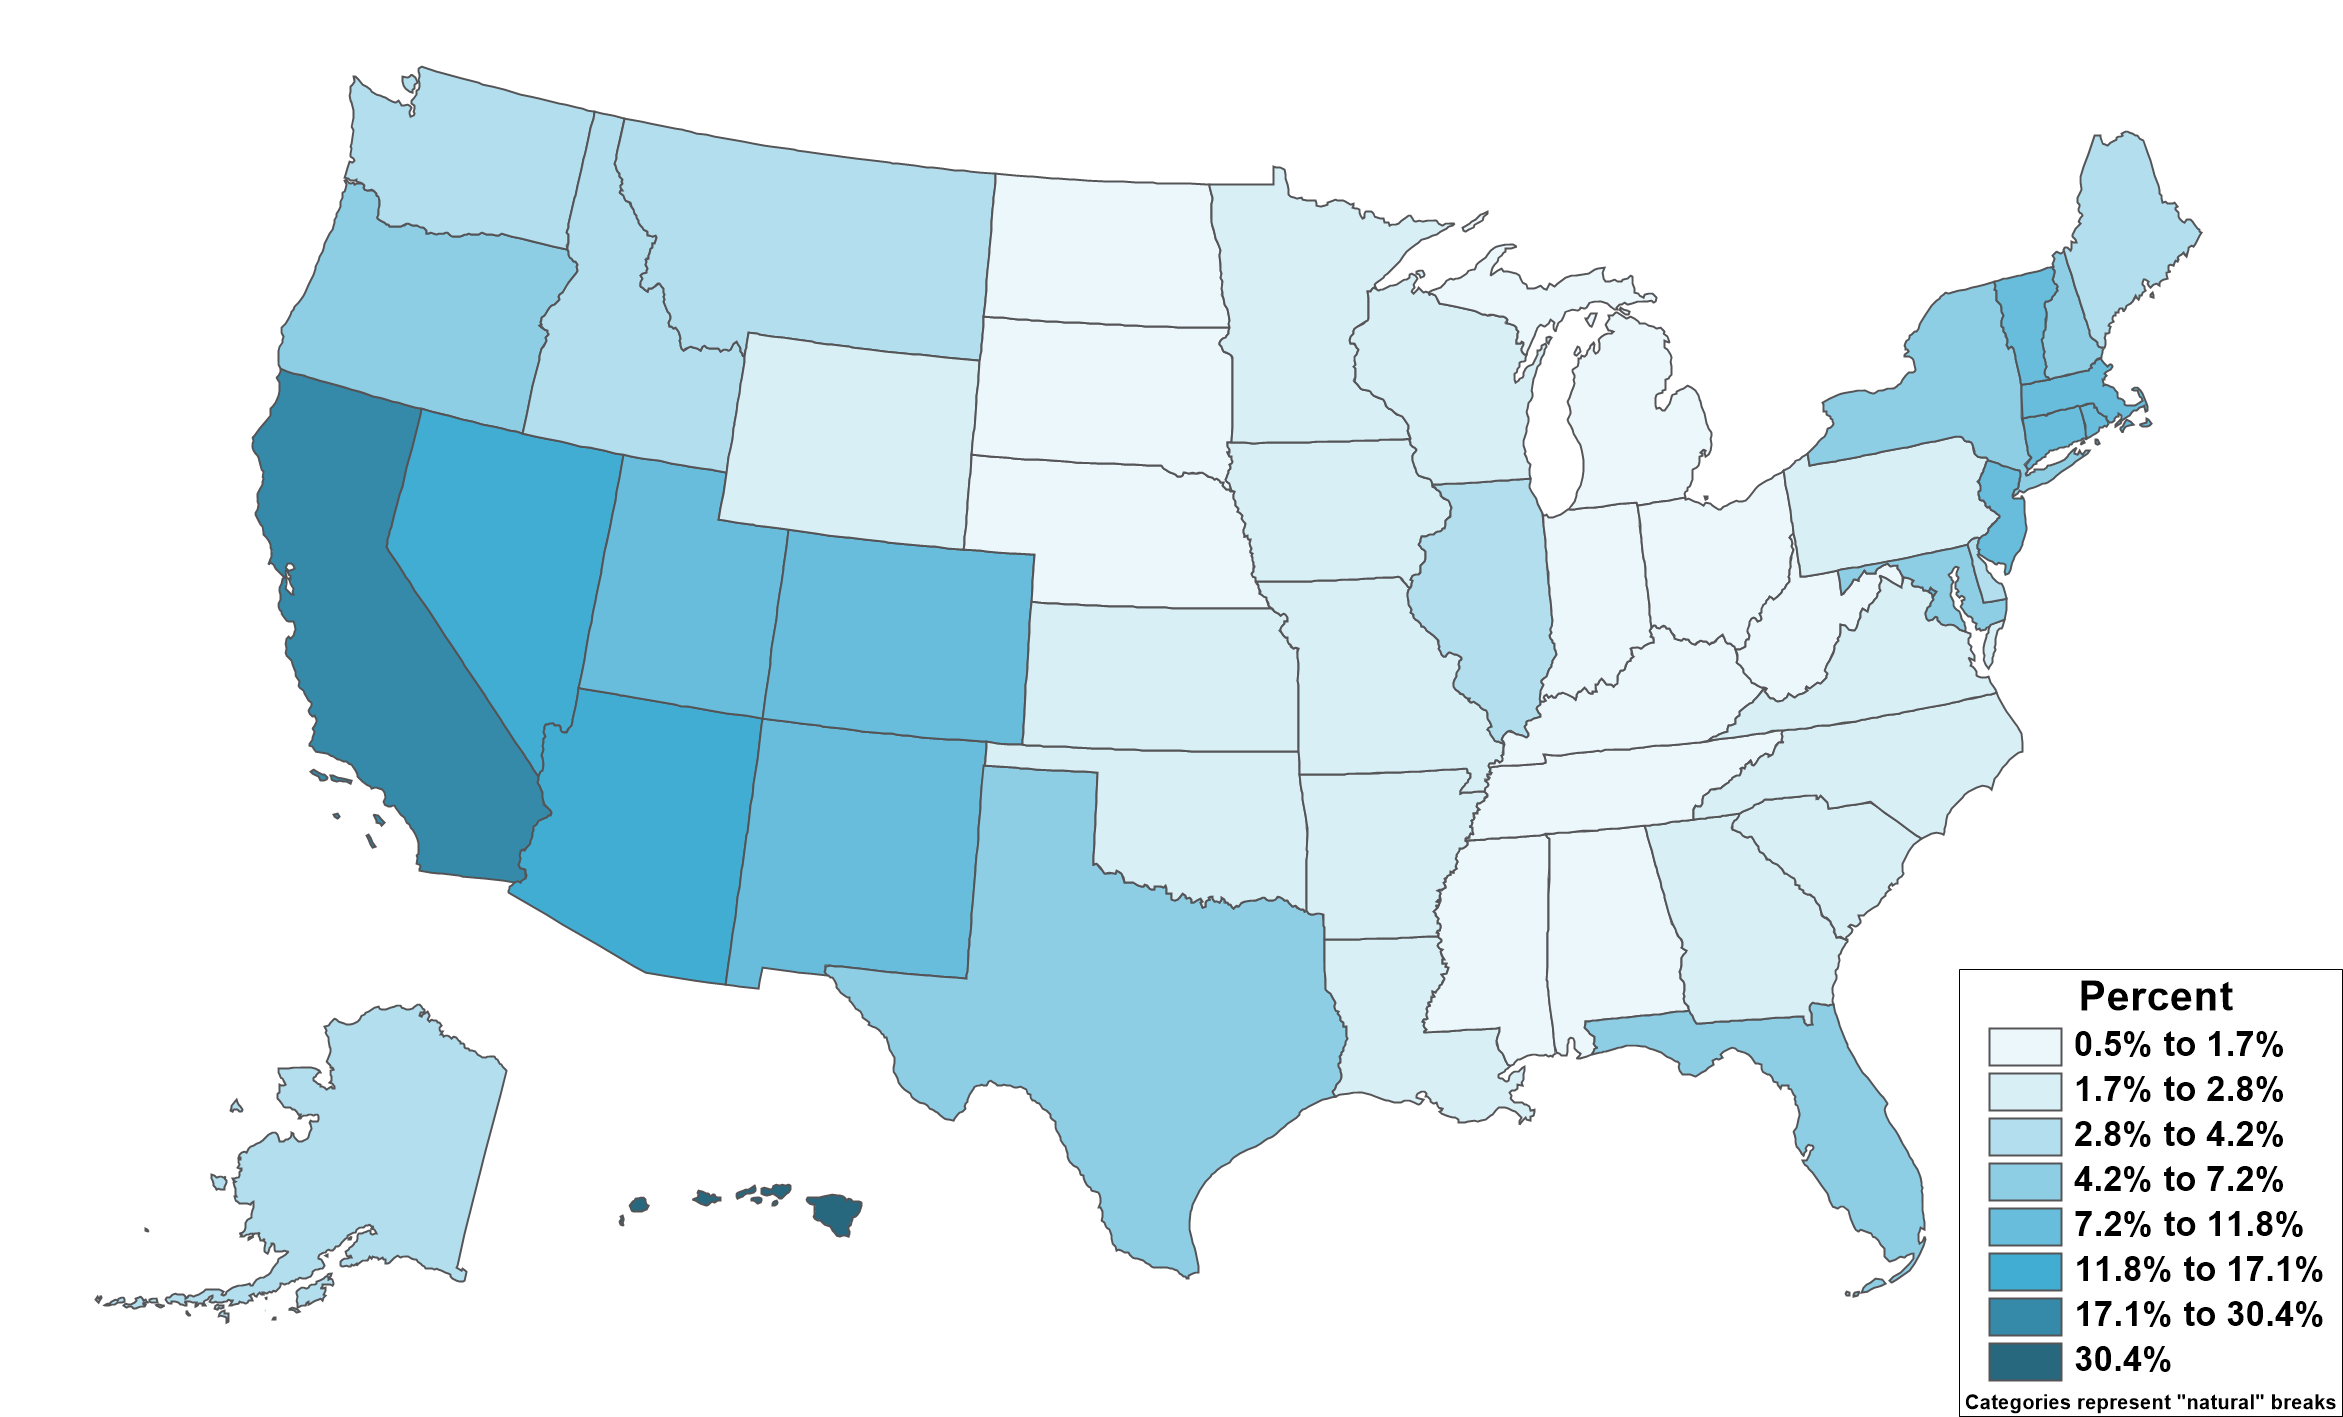
Similar to what we saw with regard to EV ownership in a previous post, Hawaii (30.4%) and California (17.1%) are again outliers. And, again similar to EV ownership, there is more widespread adoption near the coasts than in the heartland. But there are notable differences between solar and EV adoption as well. Residential solar is much more widespread in the southwest (11.8% in both Nevada and Arizona), consistent with that a more favorable angle of the sun and less cloud cover than in the northwest (2.9% in Washington state).
Oddly, the pattern is reversed on the eastern seaboard; solar adoption is higher in the northeast (9.6% in the District of Columbia; 8.5% in Connecticut; 8.4% in Vermont) than in the southeast (0.9% in Tennessee; 1.0% in Alabama). One possible explanation is that these southeastern states are at least partially served by the Tennessee Valley Authority, which has historically provided lower rates for electricity. At the state level, average residential electricity costs per kilowatt hour has a moderately strong correlation with solar adoption of .65.[4]
Georgia, at 1.7% solar coverage, ranks 39th in the nation in solar adoption and 31st in residential electricity cost.[5]
What does residential solar adoption look like among the top metros? Figure 2 breaks this down for us; the reference line represents the nationwide percentage of housing units with solar panels.
Figure 2: Percentage of Housing Units with Residential Solar among the 20 Most Populous MSAs
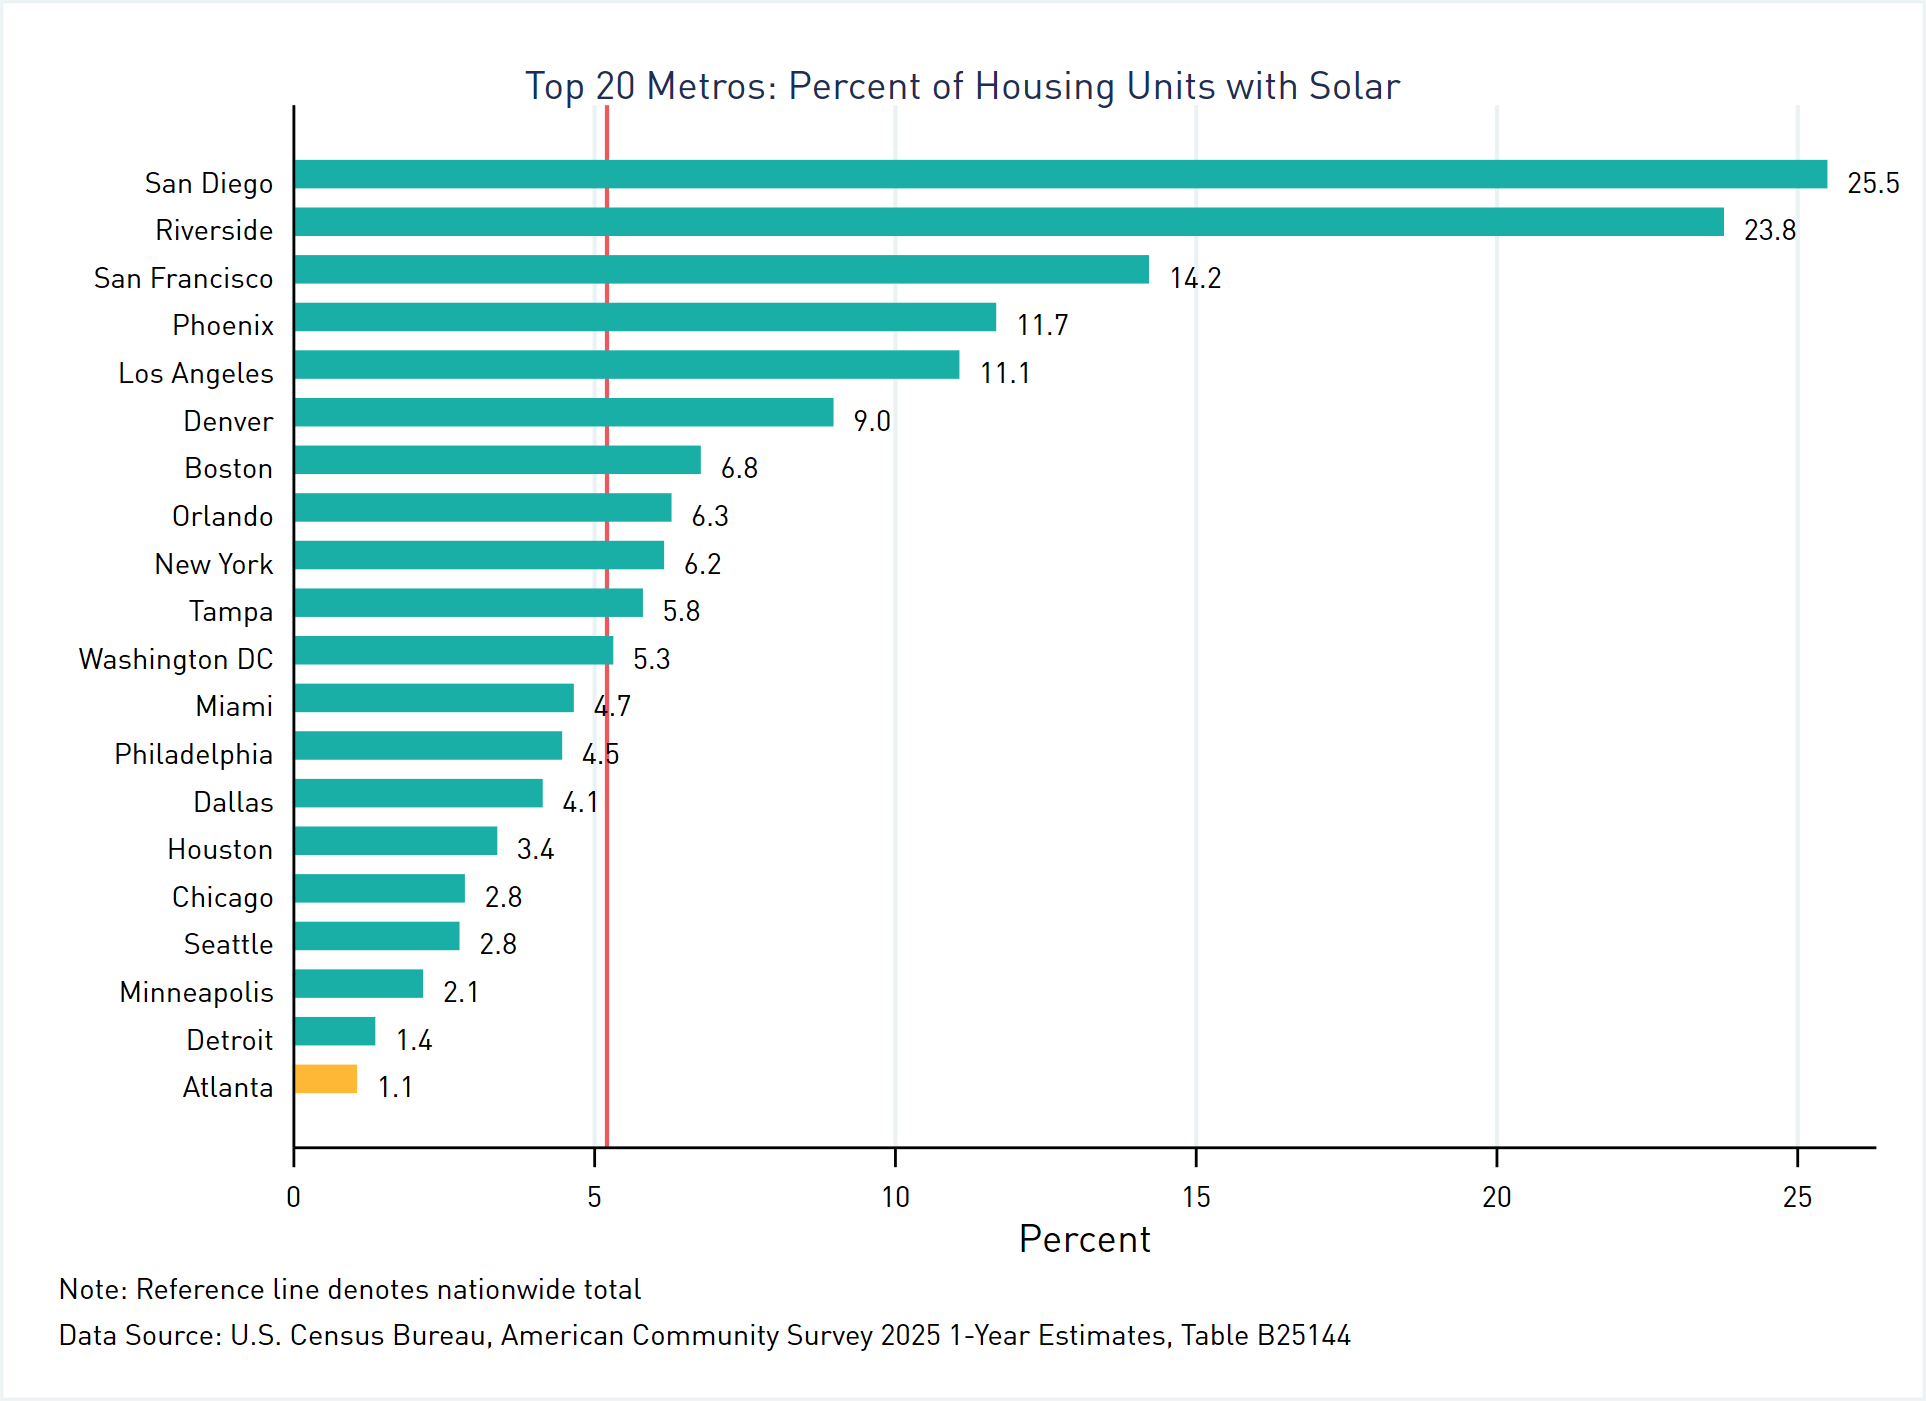
Given what we observed in the map, it should come as no surprise that solar has the greatest adoption rates in California metros. California’s four among the 20 largest metros all fall within the top 5 for solar adoption, alongside Phoenix. Seattle, a metro area where EVs are popular but that isn’t exactly known for sunshine, ranks near the bottom. Metro Atlanta ranks dead last with only 1.1% of residences having solar panels, a statistic that indicates that we can do better.
How does solar adoption vary around the Atlanta region? We’ll explore that in a future blog post.
Notes
[1] See https://www.epa.gov/power-sector/power-sector-evolution (external link) for more information.
[2] Because the question has only been asked for a single year, these data will not be available at the Census tract level for four years.
[3] The precise question wording is, “Does this house, apartment, or mobile home use solar panels that generate electricity?”
[4] Using average price to residential consumers as of August, 2026, according to the U.S. Energy Information Administration (external link).
[5] Out of 51, including the District of Columbia.