


Atlanta — Oct 09, 2026
A recent analysis by Princeton’s Eviction Lab surfaced eviction filing trends that remain concerning but that are also consistent with past years. The report covers filings in the 5 core counties of the Atlanta region between June 1, 2025 and May 31, 2026 and includes filing counts and filing rates, comparison of recent trends to a baseline period, eviction hotspots, and detailed eviction rates by imputed race/ethnicity and gender. Their reporting also allows for comparison between Atlanta and other metros, revealing persistently elevated eviction levels in the 5-county region.
We host a complementary eviction tracker at ARC, using Eviction Lab’s eviction filing data as part of a joint partnership.[1] Our tool allows analysis at additional sub-geographies of interest to our stakeholders (county, city, high school statistical area, and others) as well as visualization of trends over custom time periods beginning in January 2020. In this blog, we break down the most recently available eviction filing data by our major jurisdictions to supplement Eviction Lab’s analysis.
It is important to note a couple of caveats. First, given data limitations, we can only measure filings, not physical displacements, meaning that we do not know how many records result in housing instability.[2] Second, our tracker and Eviction Lab’s report cover a limited area within the Atlanta metro: Clayton, Cobb, DeKalb, Fulton, and Gwinnett Counties. Nonetheless, these are the five core counties of the 29-county metropolitan statistical area and the ARC 11-county region, accounting for 75% and 86% of renter households, respectively.[3]
Per the Eviction Lab report, from June 2025 through May 2026 (the most recent 12-month time period available) a startling 142,047 eviction notices were filed across 592,742 renter households in these five counties, an annual filing rate of 24%, the highest rate calculated for 11 states and 43 cities that Eviction Lab tracks.
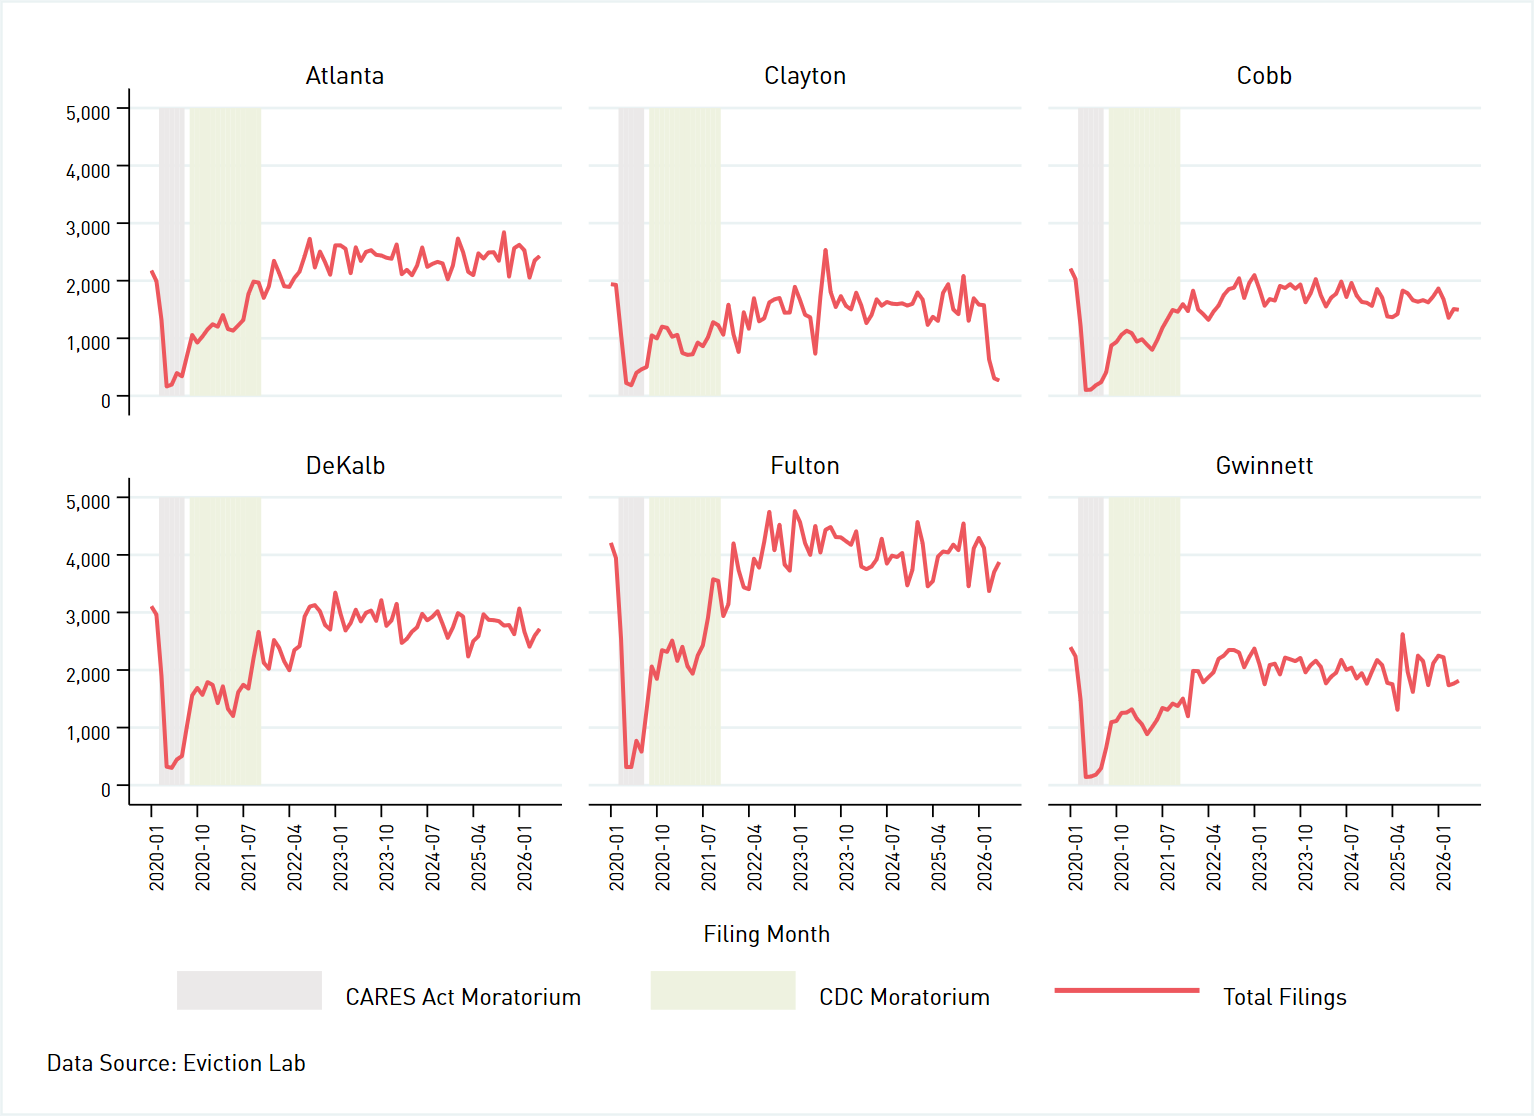
However, this is not a recent phenomenon nor does it point to a surge of filings in the data. In a previous post, we showed that the 5-county Atlanta region’s monthly eviction filing rate has tracked well above that of several of our peers since 2020.[4] And in fact, Eviction Lab reports that the 5-county region’s current eviction rate is actually 5% below its baseline annual average. It is at or below the 5-year baseline in each of the five counties and the City of Atlanta during this same period. Eviction filing levels fell during the U.S. Centers for Disease Control-issued eviction moratorium during the COVID-19 pandemic but returned to pre-COVID levels in more recent years, as shown in Figure 1.
Figure 1: Filings by month by major jurisdiction, January 2020 through May 2026
When we break down the most recent 12-month period by major jurisdiction, we see a few differences (Table 1). Clayton had a relatively high annual eviction filing rate at 37%. All other counties and the City of Atlanta hovered around the 5-county rate of 24%. Notably, while Clayton accounted for 11% of eviction filings, it only represented 7% of all renter households in the 5-county region. Other counties and the City of Atlanta were more balanced, with Cobb and Gwinnett making up a slightly smaller share of eviction filings relative to their share of renter households in the region compared to other jurisdictions. Fulton and DeKalb Counties accounted for the largest shares of total evictions (34% and 24%, respectively), which is not surprising given the concentration of renters in these counties.
Table 1: Differences in filing rates and share of eviction filings versus share of renter households by major jurisdiction
| Filing Rate, 6/1/2025-5/31/2026 | Share of Eviction Filings in 5-County Region | Share of 5-County Renter Households | |
| City of Atlanta | 23% | 21% | 22% |
| Clayton | 37% | 11% | 7% |
| Cobb | 20% | 14% | 16% |
| DeKalb | 25% | 24% | 22% |
| Fulton | 23% | 34% | 35% |
| Gwinnett | 21% | 17% | 19% |
| 5-County Region | 24% | 100% | 100% |
What is behind such a high filing rate? Eviction Lab’s data provide some clues in the report’s serial filing rate and the eviction hot spot analysis. A serial filing results when a landlord files to evict a tenant more than once at the same address, often as a rent collection tactic. The 5-county Atlanta region’s serial filing rate from June 2025 through May 2026 was 36%, 15 percentage points higher than Phoenix (Maricopa County), which has the second-highest eviction filing rate among large metro areas tracked by Eviction Lab. In a previous analysis, Eviction Lab researchers also found that 100 landlords accounted for 15% of filings between March 2025 and February 2026, another indication that serial filing is occurring. Low legal and regulatory barriers to filing exacerbate the 5-county Atlanta region’s high serial eviction filing rate. [5,6]
Despite the limitations in these data, eviction filings provide a warning sign for the region. Housing stability is an important driver of physical, mental, and economic wellbeing and a foundation for achieving economic mobility. Persistently high eviction filing rates point to structural issues in the system that warrant a collaborative, regional approach.
Notes:
[1] Partners include the Federal Reserve Bank of Atlanta, the Atlanta Regional Commission, Georgia Tech, the Atlanta Volunteer Lawyers Foundation, and Assemblage Consulting.
[2] Eviction filings are a proxy for instability, not an exact count of the physical displacement of renters. The data may result in an overcount of formal dispossessories, as filings can occur against the same household multiple times without resulting in a move (known as “serial filings”). Conversely, filings miss informal displacements where families vacate a property upon receiving a threat of eviction before a formal legal filing ever enters the court system. Filings that do not result in eviction still negatively impact renters: they can appear on a tenant’s screening report and can be used to deny future rental applications.
[3] U.S. Census Bureau, American Community Survey 2024 1-Year Estimates, Table B25003
[4] Note that our previous post reported monthly rather than annual filing rates, which are naturally lower than the annual rate (a 24% annual rate equates to a 2% average monthly rate).
[5] Leung, Lillian, Peter Hepburn, and Matthew Desmond. “Serial eviction filing: Civil courts, property management, and the threat of displacement.” Social Forces 100, no. 1 (2021): 316-344.
[6] Immergluck, Dan, Jeff Ernsthausen, Stephanie Earl, and Allison Powell. “Evictions, large owners, and serial filings: Findings from Atlanta.” Housing Studies 35, no. 5 (2020): 903-924.