


Posted on: March 08, 2016
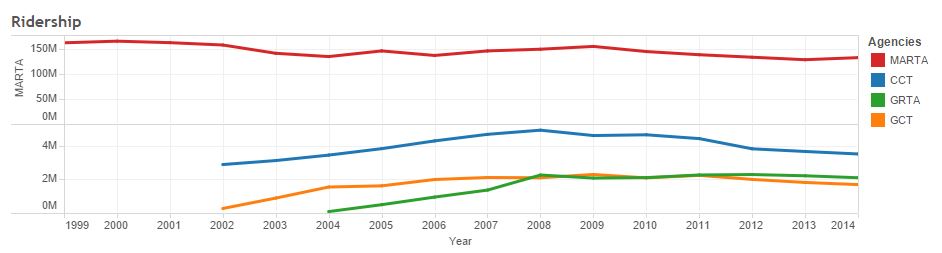
Transportation Tuesday this week looks at transit ridership data in metro Atlanta. This interactive dashboard, from the Atlanta Regional Transportation Factbook, shows transit ridership from 1999-2014 for four different agencies (MARTA, CCT, GRTA, and GCT). The dashboard also shows the number of boardings (people getting on the train) by MARTA rail stations.
- Transit ridership has remained fairly constant over the past 10 years. A slow decline starting in 2009 is now starting to turn upward.
- Individual MARTA station boarding comparisons remain fairly consistent. As the system hub, Five Points has the most boardings. Stations in denser development settings also have more total boardings.
For more transportation data, check out the interactive dashboards in the Transportation Factbook (external link) on The Atlanta Region’s Plan site.

Data Sources: National Transit Database, Georgia Regional Transportation Authority, Metropolitan Atlanta Rapid Transit Authority (MARTA).







