


Posted on: August 23, 2016
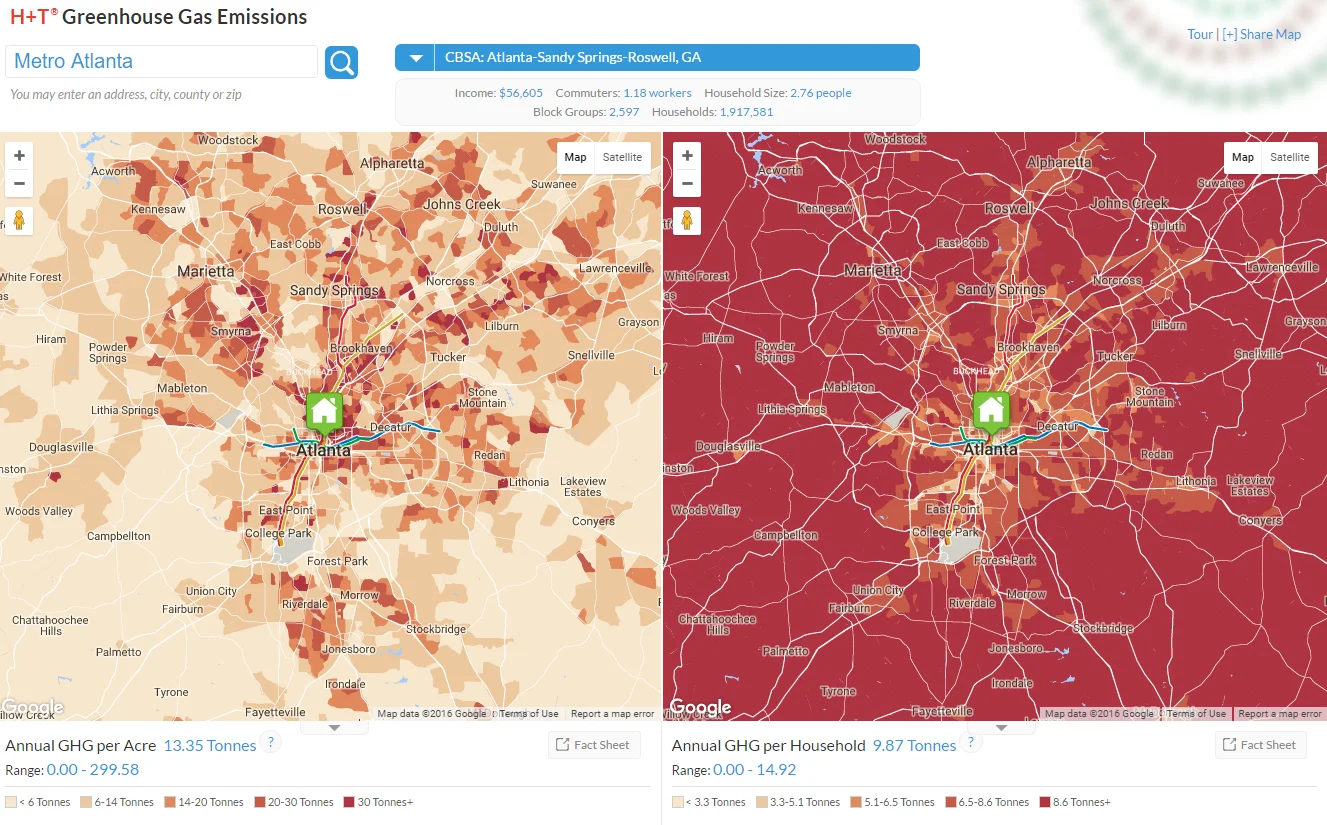
Using The Center for Neighborhood Technology’s Housing +Transportation (H+T®) Affordability Index mapping tools, the images below show greenhouse gas emissions throughout metro Atlanta. The data use transportation and household factors to model annual greenhouse gas emissions per acre (left) and per household (right). The emissions per acre map shows higher concentrations in the urban core and along the interstates, reflecting patterns of economic activity. The emissions per household map tells a different story, with lower concentrations in the core and higher in the surrounding areas, reflecting population density patterns and increased auto use in more car-dependent neighborhoods.
Click the image to enlarge, and check out CNT’s Index website (external link) for interactive tools. 







