Posted on: May 22, 2017
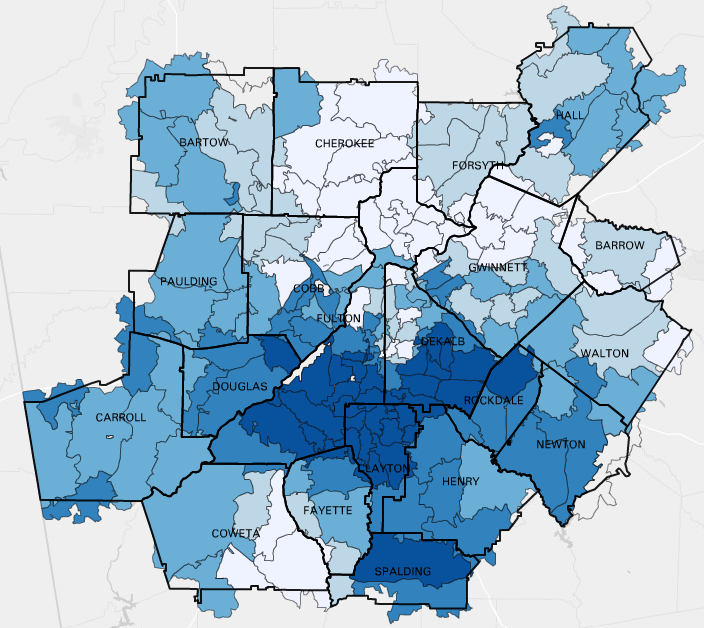
Using Zillow data for Q3 of 2016, this map shows the percentage of homes that have negative equity (owe more on the house than what it is worth) for zip codes in metro Atlanta. The darker blue areas have higher percentages of homes with negative equity. The spatial patterns here roughly reflect the same patterns of income, with higher poverty neighborhoods more likely to have higher percentages of homes with negative equity.
Source: Zillow via Neighborhood Nexus (external link)
Percentage of homes with negative equity
5-8%
8-9%
9-13%
13-21%
21-49%