


Posted on: February 01, 2021
The Federal Reserve Bank of Atlanta recently updated its Mortgage Analytics and Performance Dashboard, which shows where residents have fallen behind on mortgage payments at the state, county and zip code level. Updated monthly, with a time lag for data processing, the dashboard provides insight on where homeowners likely are feeling more economic distress related to the pandemic.
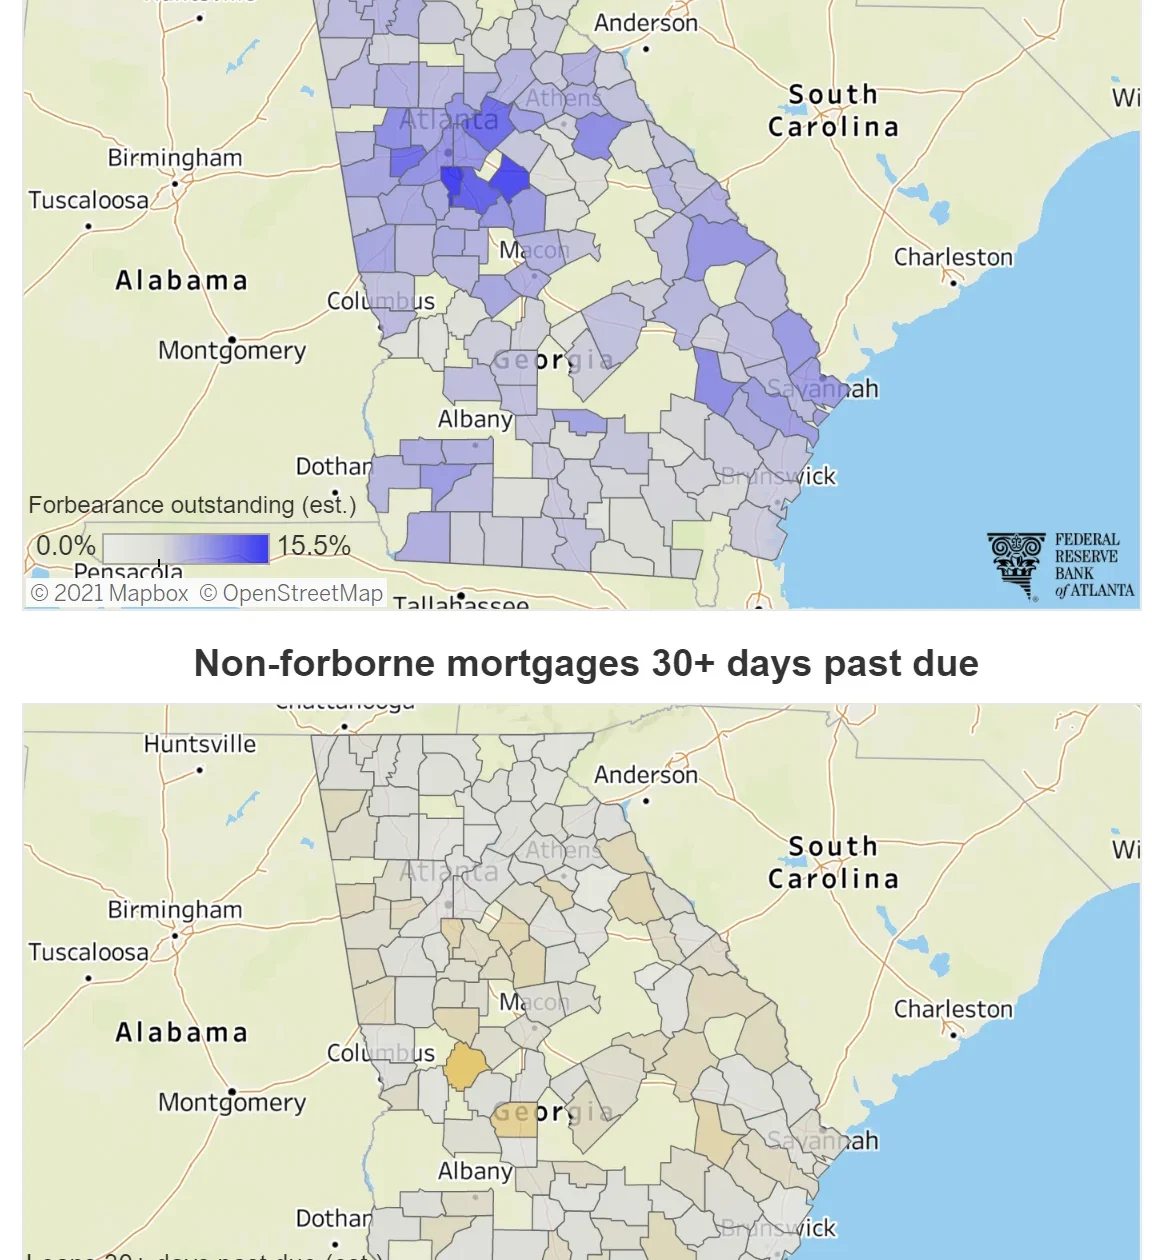
In the series of maps below, we can see how both forbearance and late payments have grown and ebbed from the start of the pandemic through October, with June showing the greatest rates of forbearance.
April 2020
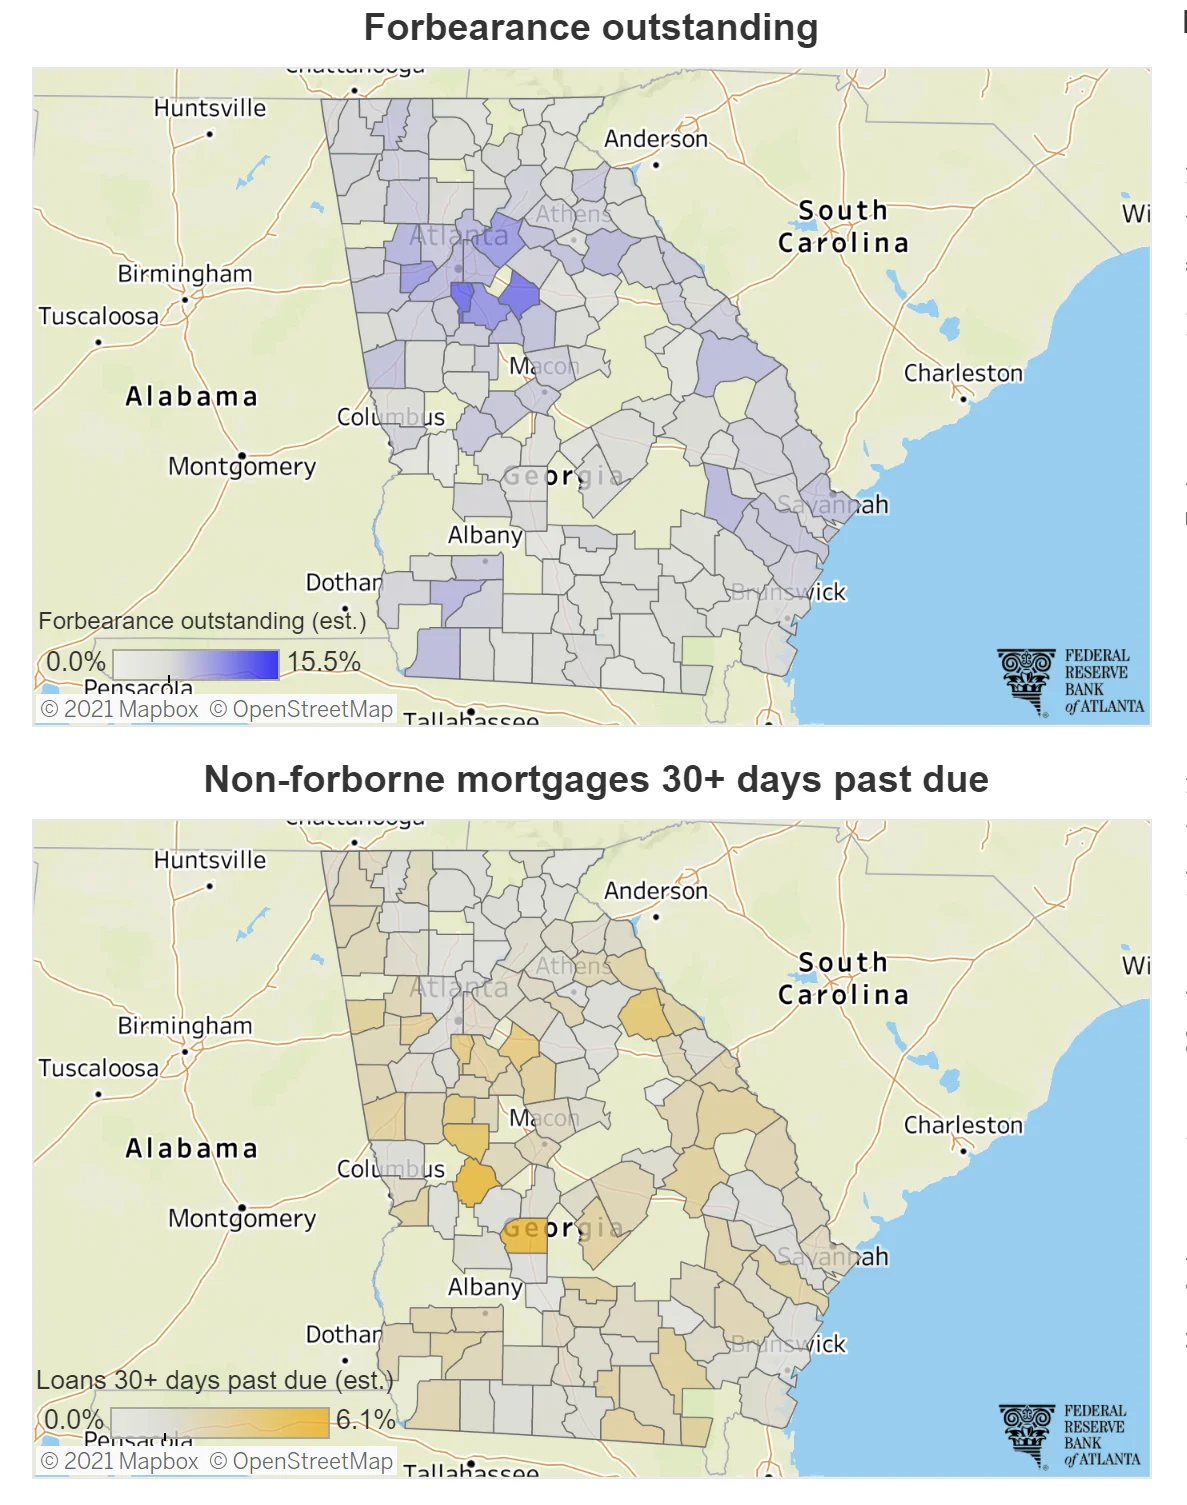
June 2020
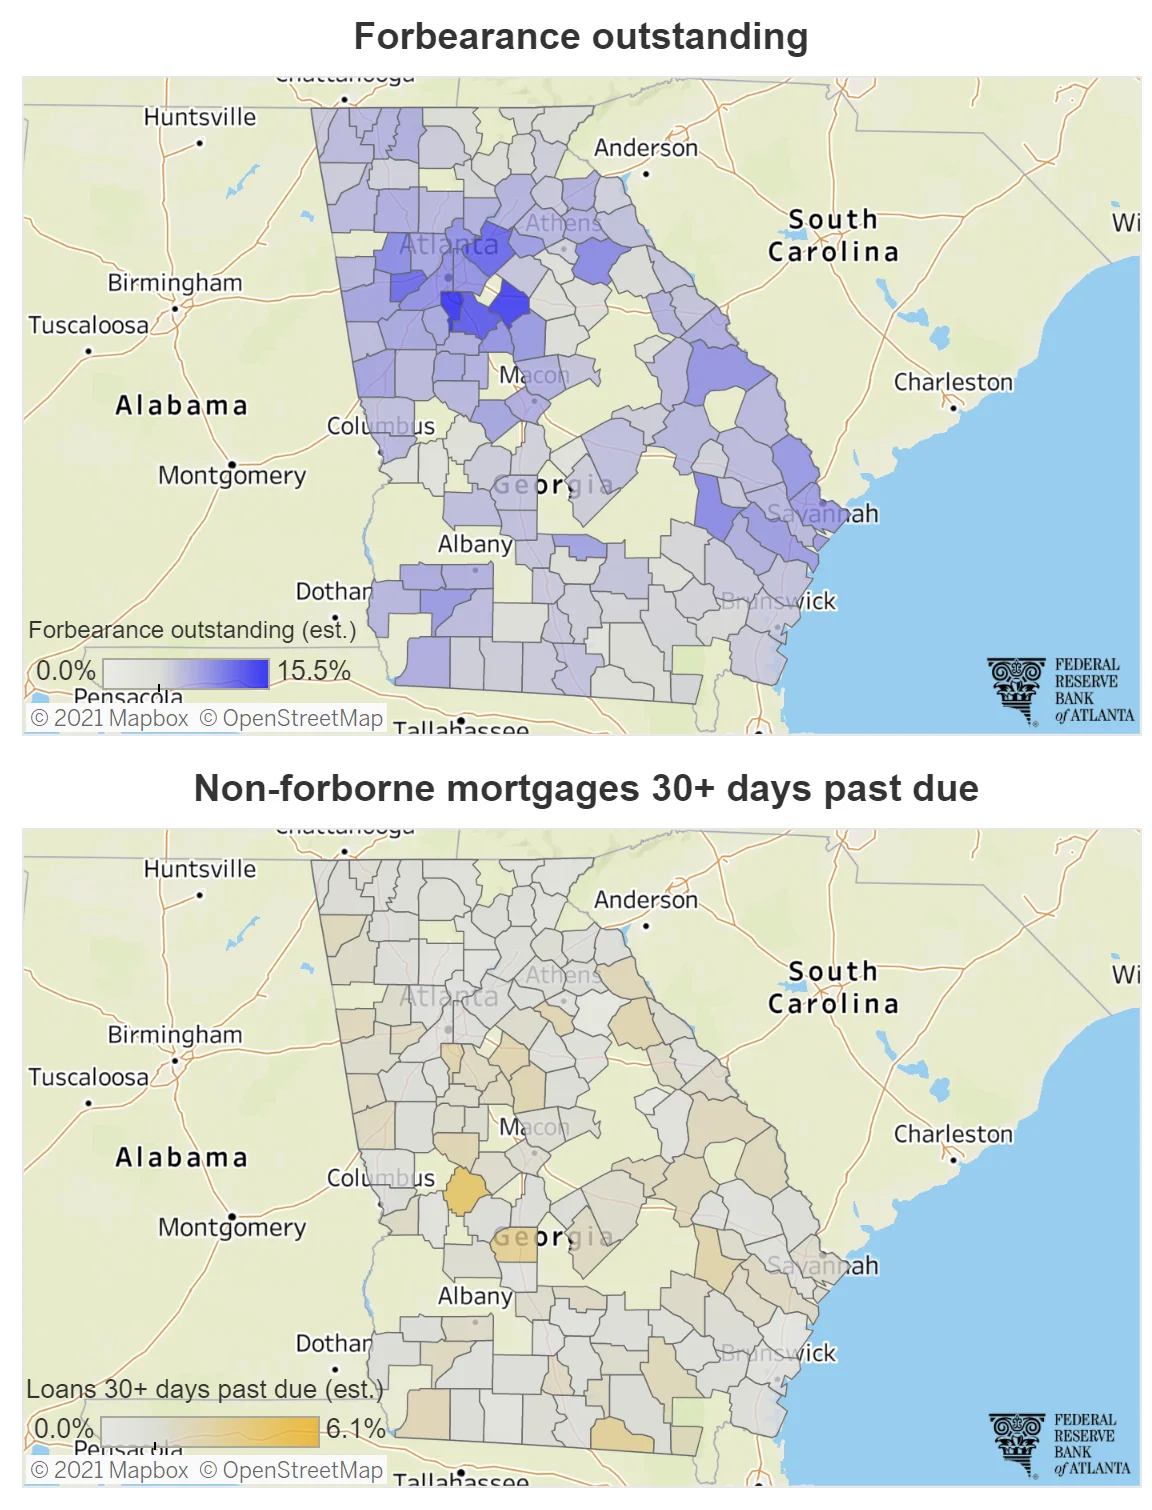
October 2020
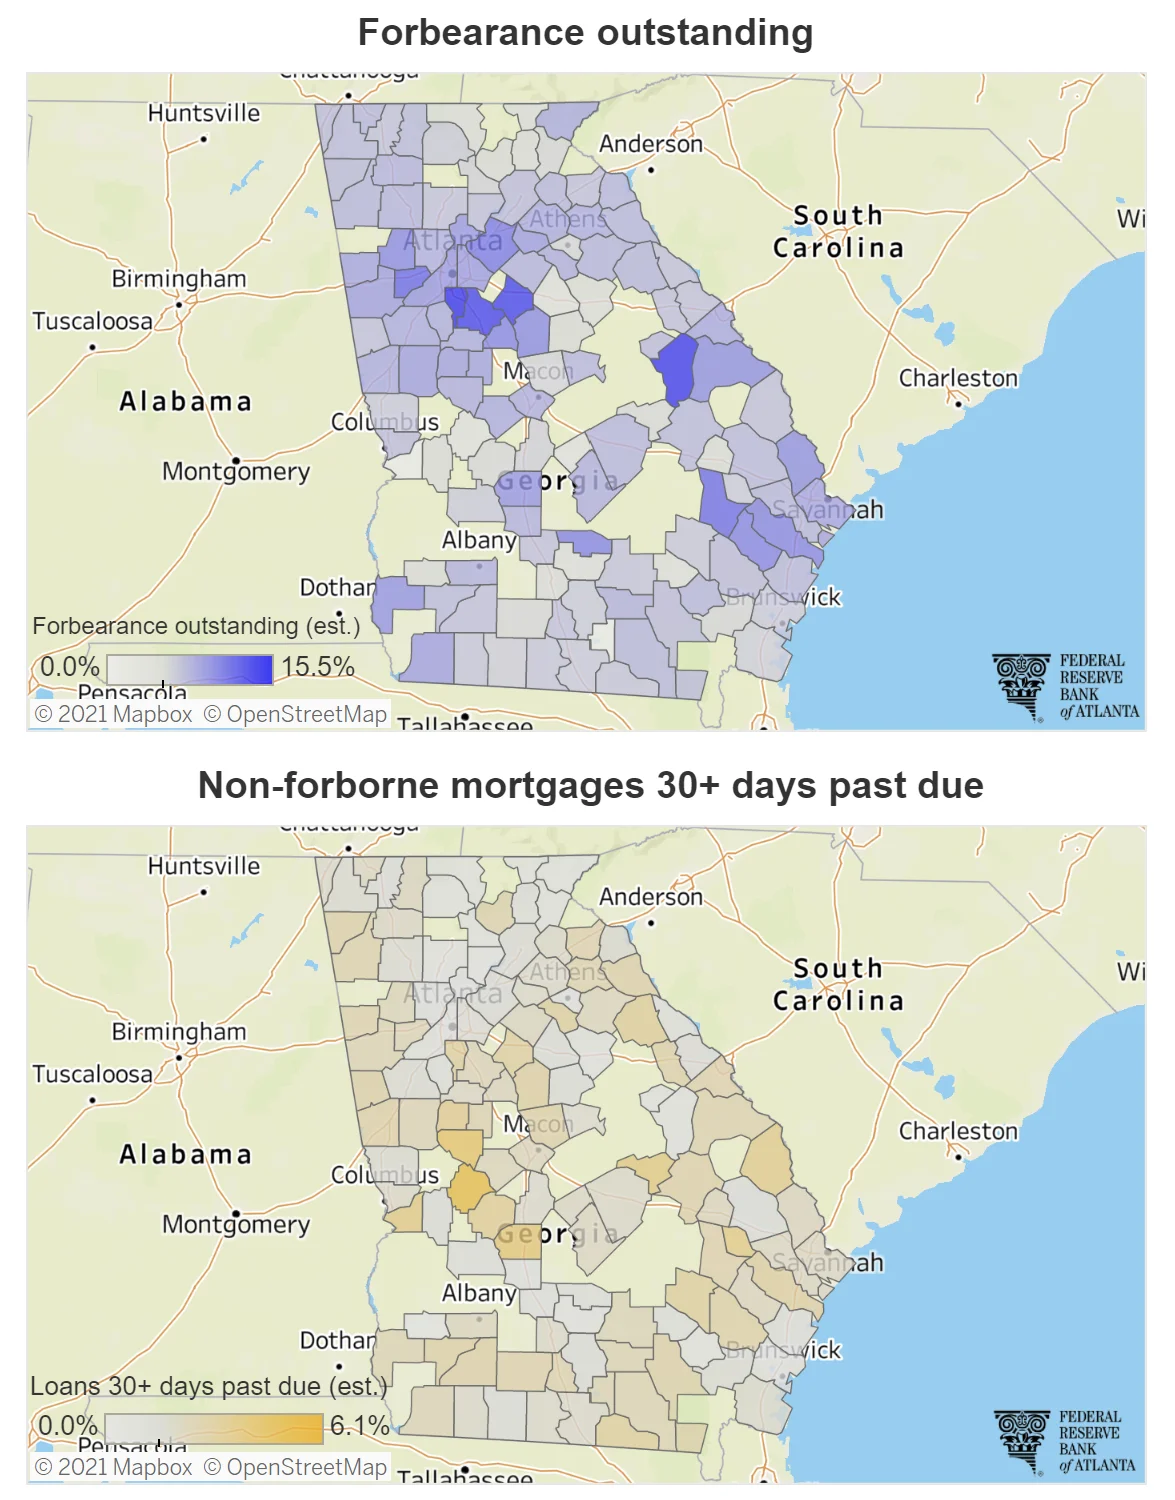
This tool can be coupled with the dashboards available through ARC's Metro Atlanta Housing Strategy to better understand where residents might be feeling increased pressure during the economic downturn.







