


Posted on: August 01, 2016
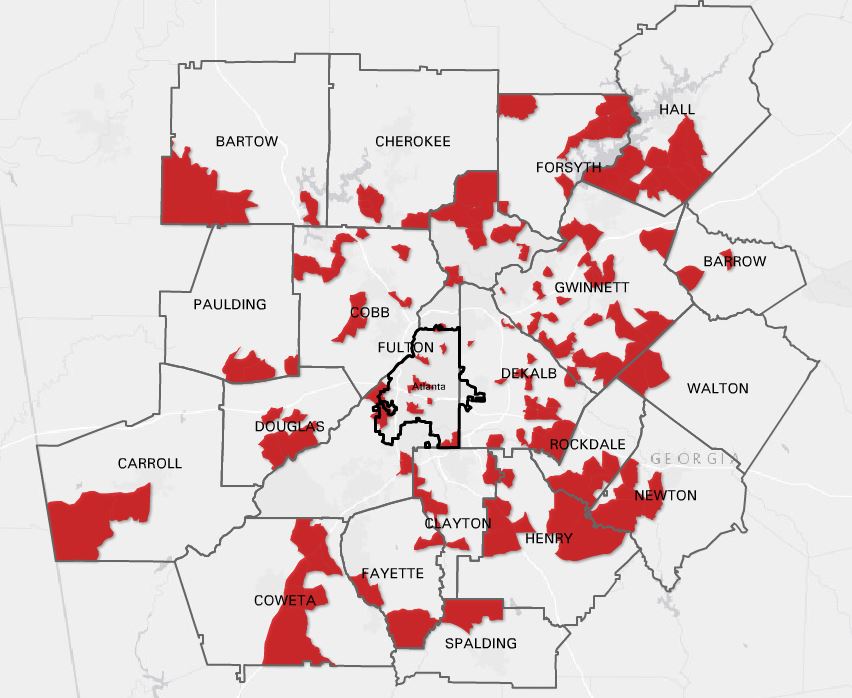
In most parts of metro Atlanta, teen birth rates have been decreasing. This map looks at the change in birth rates from 2000-2004 (an average for the 5 year period) to 2010-2014 (another average).
The red areas highlighted had an increase in teen birth rates. In these areas, the increase in birth rates for teen mothers (ages 15-19) ranged from 0.5 to 67.5 per 1,000 births. Areas with increases in teen births are mainly in the suburbs of metro Atlanta.
This map was made using the Neighborhood Nexus Weave tool. Data source: Georgia Department of Public Health. 







