Posted on: December 19, 2016
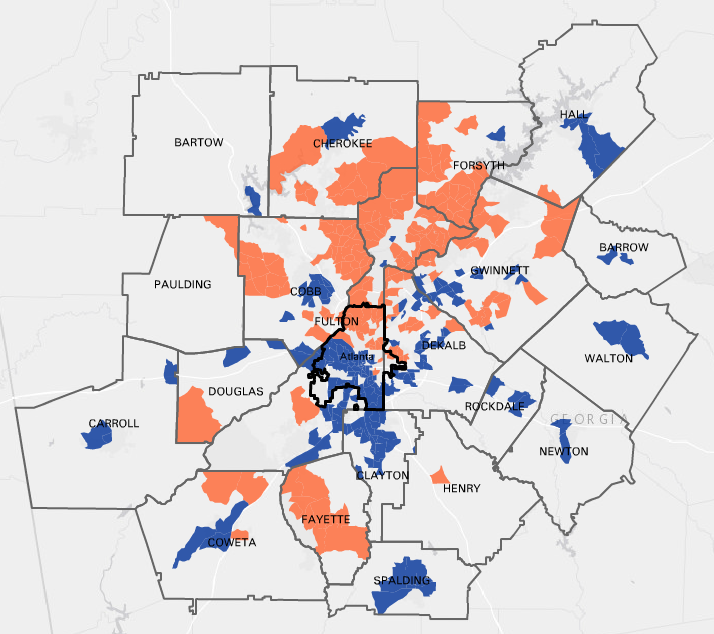
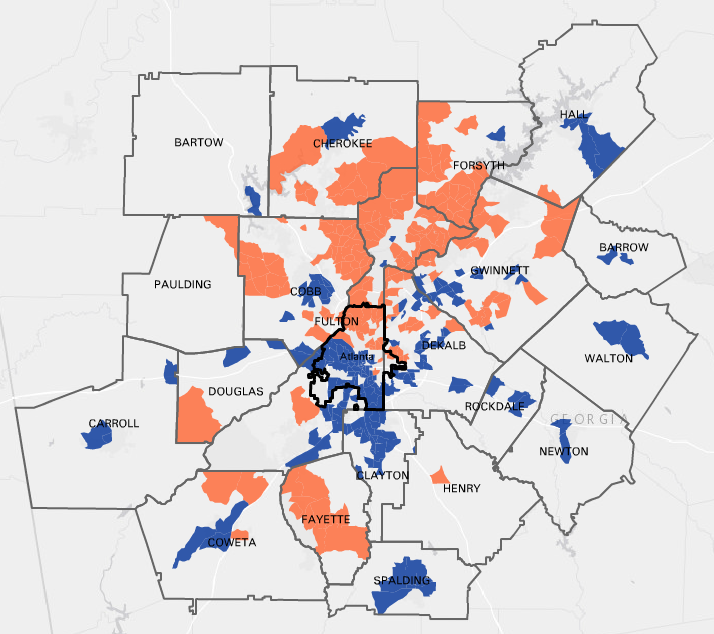
Using new U.S. Census Bureau data (2011-2015 American Community Survey via Neighborhood Nexus), this map shows the top 20% of neighborhoods with the highest median household incomes (orange) and the 20% with the lowest median household incomes (blue). The areas with the highest median incomes have a household income ranging from $81,250 to $178,438. Those with the lowest median incomes range between $10,000 and $37,632.
We can see that the wealthiest neighborhoods are clustered in the northern part of the region, as well as in Fayette County. While there is a concentration of low-income neighborhoods in the urban core, this map demonstrates the suburbanization of poverty with low-income pockets forming a ring in suburban counties such as Spalding and Hall.