


Posted on: July 25, 2016
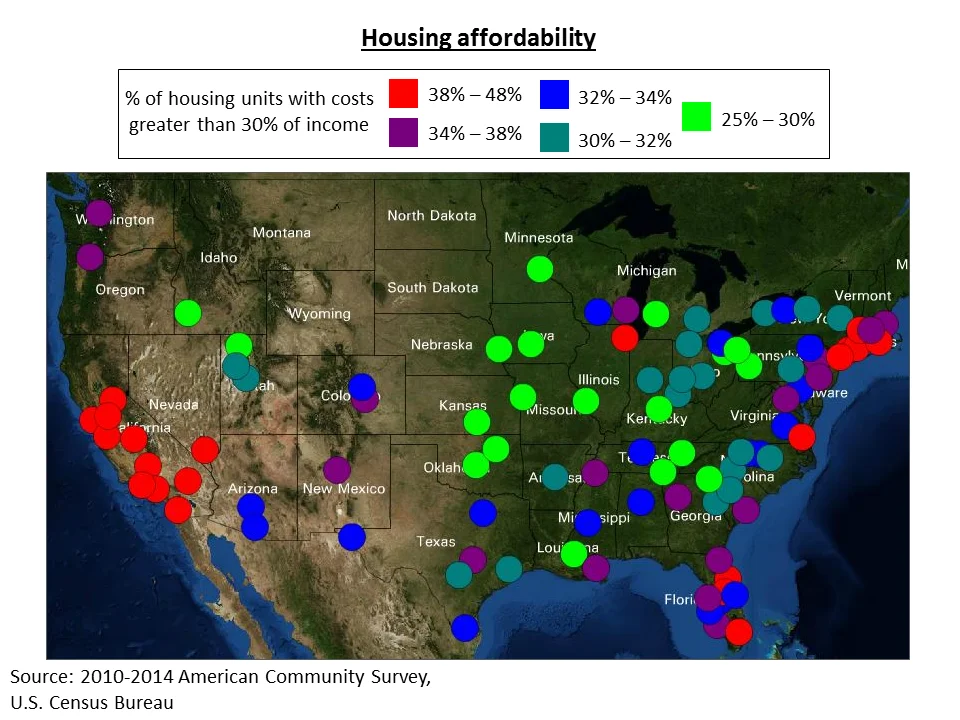
This map compares housing affordability in the 100 largest U.S. metros. One way to measure housing affordability is to consider the percentage of income that is spent on housing costs. Housing is generally considered unaffordable when housing costs exceed 30% of income.
The colored circles on the map represent the metro areas and indicate what percentage of housing units (both rented and owned) have costs greater than 30% of income. Metros in California and the northeast have some of the highest percentages of affordable housing units. Metro Atlanta falls into the second highest category, with nearly 35% of housing units having costs exceeding 30% of income.
This map was created using the Neighborhood Nexus 100 Metros Map (external link). 







