


Posted on: August 14, 2017
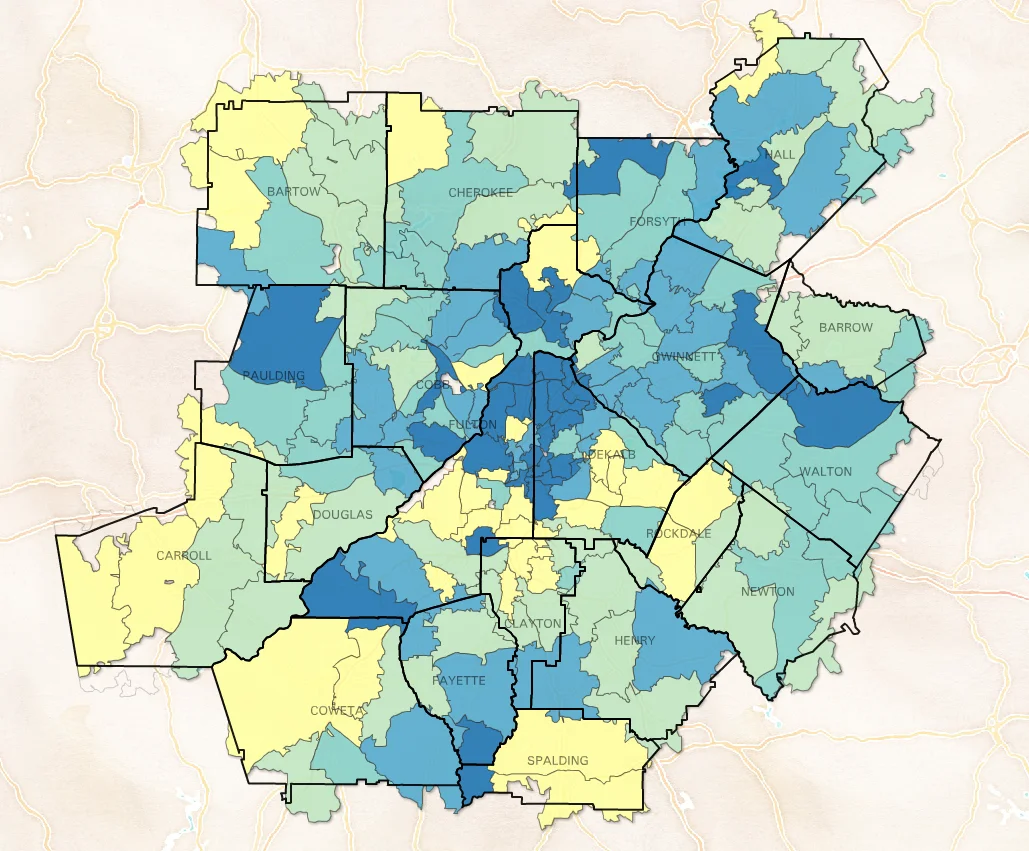
When viewed at the zip code level, average home sale listing prices between 2012 and 2017 have increased everywhere across the 20-county Atlanta Metro Region*. The magnitude of increase, however, exhibits significant variation based on where within the region a home was sold, with the largest increases being shown in blue and the smallest in yellow on the map below. Within the Atlanta Metro Region, the 30317 zip code, which contains the neighborhoods of Kirkwood, Parkview, and East Lake, had the largest average increase of $226,833.
Home Sale Price Change (2012-2017)
by Zip Code


*Data provided by Redfin (external link), a national real estate brokerage.







