
33°n - Finding Meaning of 33.7°N

Monday Mapday: Georgia’s Population Change by Zip Code

Posted Under: 33°n

Written by ARC Research

Posted on: March 21, 2016

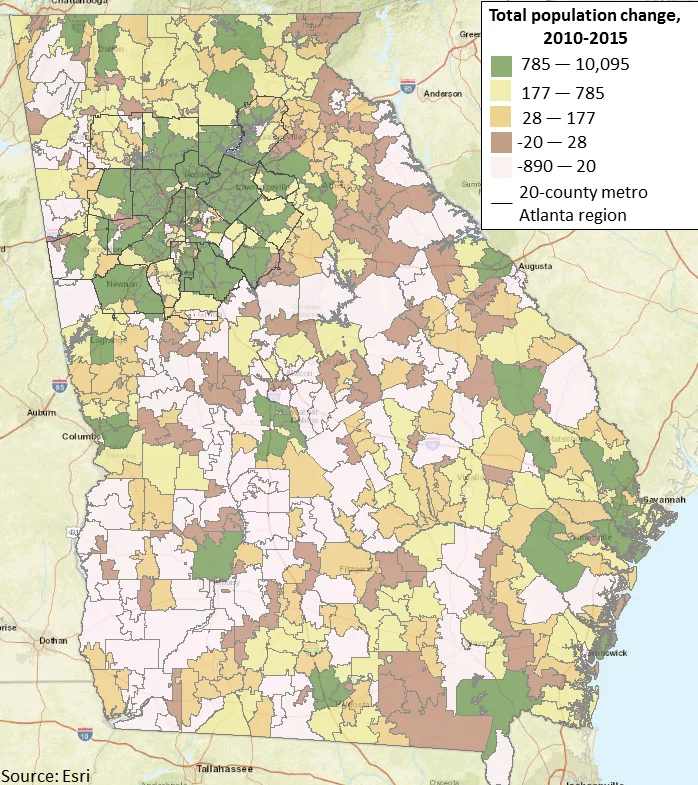
This map shows total population change by zip code throughout Georgia from 2010-2015. The zip codes in green have had the greatest amounts of population growth while areas in pink have seen a loss in population. The majority of zip codes in the 20-county metro Atlanta region have seen large increases in population.

Powered by ARC
33°n
CDAP
Community Planning Academy
ConnectA
Empowerline
Georgia Commute Options
Green Communities
LCI
LINK
MARC
Metro Atlanta Speaks
MNG Water Planning District
RLI
State of the Region
UASI
WorkSource GA
33°n
CDAP
Community Planning Academy
ConnectA
Empowerline
Georgia Commute Options
Green Communities
LCI
LINK
MARC
Metro Atlanta Speaks
MNG Water Planning District
RLI
State of the Region
UASI
WorkSource GA


