
33°n - Finding Meaning of 33.7°N

Monday Mapday: 2014-2015 Employment Change by Metro

Posted Under: 33°n Economy

Written by ARC Research

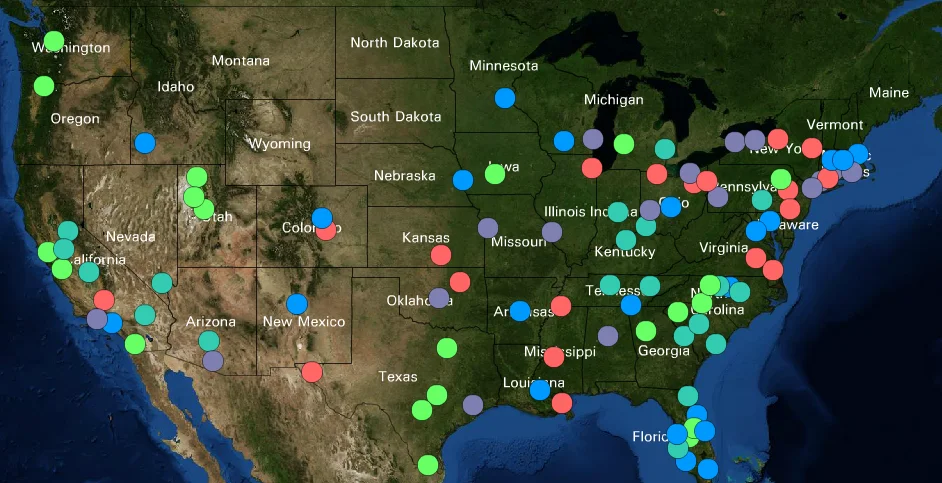
Employment change by metro 2014-2015

Posted on: May 02, 2016

This map shows the top 100 largest metros in the U.S symbolized by the percent change in employment from 2014-2015. The metros with green circles had the greatest increase; metro Atlanta falls into this group with an increase of 2.9% for the one-year period. To explore this interactive map and 500 other variables visit the 100 Largest Metros map (external link) on Neighborhood Nexus.

Powered by ARC
33°n
CDAP
Community Planning Academy
ConnectA
Empowerline
Georgia Commute Options
Green Communities
LCI
LINK
MARC
Metro Atlanta Speaks
MNG Water Planning District
RLI
State of the Region
UASI
WorkSource GA
33°n
CDAP
Community Planning Academy
ConnectA
Empowerline
Georgia Commute Options
Green Communities
LCI
LINK
MARC
Metro Atlanta Speaks
MNG Water Planning District
RLI
State of the Region
UASI
WorkSource GA


