


Posted on: March 10, 2017
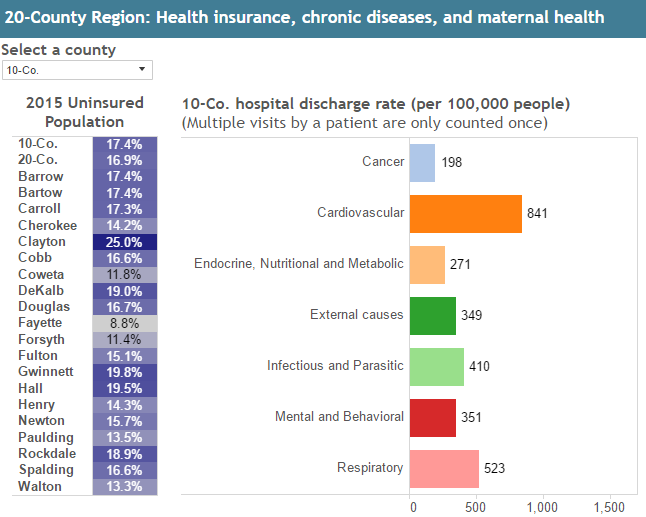
The charts below show selected health metrics for each of the counties in the 20-county region, as well as 10-county and 20-county aggregations. Numbers are provided for the following:
- Percentage of population without health insurance (an average of years 2011-2015)
- The cause of discharges from hospitals by chronic disease type (rate is per 100,000 people, 2015)
- Percentage of births in 2015 classified as low birthweight
- 2015 teen pregnancy rate (pregnancies per 1,000 females age 15-19)
For more county-level data, visit the 20-County Data Dashboard.








