


Posted on: September 07, 2015
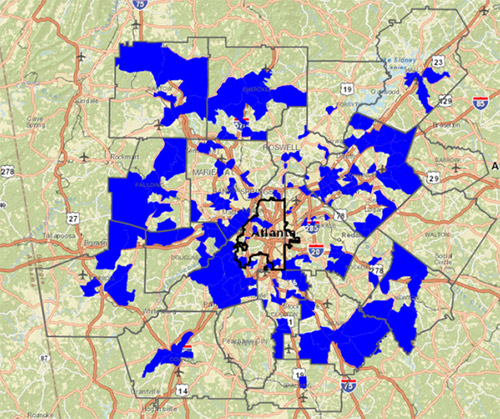
These maps isolate those census tracts where the Stork has been the busiest. The first map shows the total number of births between 2009 and 2013. These are concentrated mostly in exurban areas where the tracts are pretty big. The second map shows the number of births per square mile between 2009 and 2013. This paints a different picture as areas in and around the urban core (where tracts are smaller), especially along the Buford Highway corridor where there are heavy concentrations of Hispanic and other foreign-born populations.Total Number: Where the Most Babies Were Born, 2009-2013  Per Square Mile: Where the Most Babies Were Born, 2009-2013








